Configuring Stack Framework Settings
When I need to set up my AI orchestration layer, I want to configure framework settings for my stack, so I can control how my AI workload is orchestrated, observed, and logged.
Introduction
In Lattice, the Framework section of a stack defines how your AI workload is orchestrated and monitored. This includes choosing orchestration frameworks like LangGraph or LangChain, setting up observability with tools like LangSmith or Langfuse, and configuring logging and tracing options.
Framework configuration is crucial for production deployments where you need visibility into AI behavior, debugging capabilities, and performance monitoring.
Step 1: Access Stack Configuration
The ContextBar shows your current stack configuration:
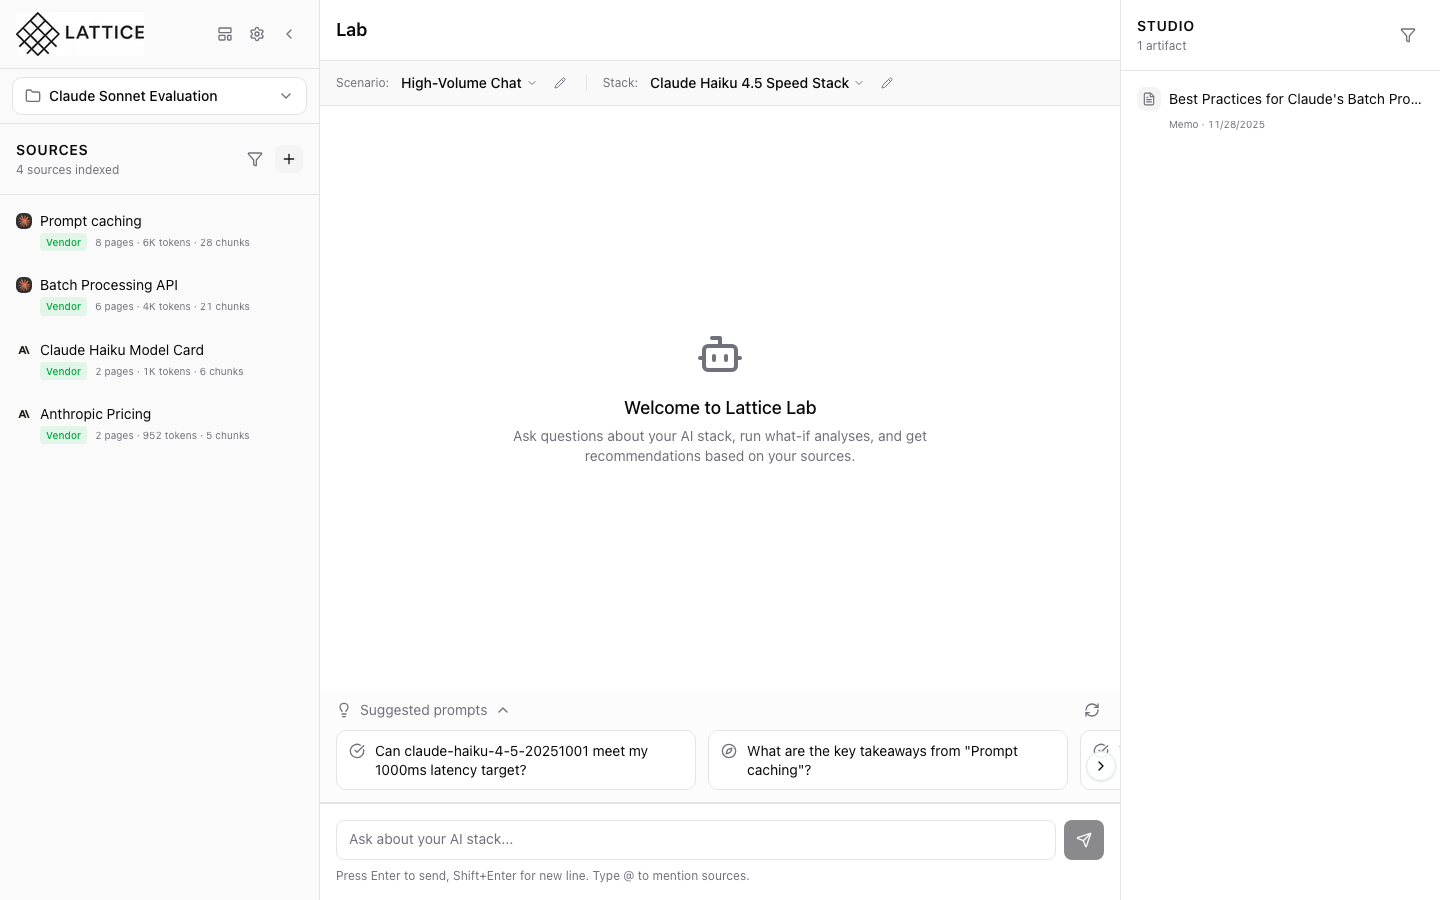
Quick Access
- Stack Name: Current stack displayed in ContextBar
- Edit Button: Pencil icon for direct access to configuration
- Paired Scenario: Your workload context
Click the pencil icon next to your stack name to open the configuration form.
Step 2: Stack Configuration Form

The StackConfigForm opens showing the Model section:
Form Sections
- Model: Provider, model, temperature, max tokens
- Framework: Orchestration and observability (scroll to access)
- Hardware: Cloud provider, GPU, region
The form uses collapsible sections to organize complex configurations. Scroll down to access the Framework section.
Step 3: Orchestration and Observability

The Framework section reveals orchestration options:
Orchestration
- LangGraph: State machine-based orchestration for complex workflows
- LangChain: Chain-based orchestration for sequential processing
- Custom: Use your own orchestration framework
Observability
- LangSmith: Tracing and debugging from LangChain team
- Langfuse: Open-source LLM observability platform
- Custom: Integration with your own observability stack
These options control how your AI workflows are structured and monitored.
Step 4: Logging and Tracing

Scrolling further reveals logging configuration:
Logging Options
- Log Level: Debug, Info, Warning, Error
- Trace Sampling: Percentage of requests to trace
- Retention: How long to keep logs and traces
Tracing Options
- Enable Tracing: Toggle for full request tracing
- Trace Storage: Where traces are persisted
- Trace Export: Integration with external systems
These settings give you fine-grained control over debugging and monitoring capabilities.
What You’ve Accomplished
You’ve learned how to configure framework settings in Lattice:
- Access the form — Click the edit button in ContextBar
- Navigate sections — Scroll to the Framework section
- Select orchestration — Choose LangGraph, LangChain, or custom
- Configure observability — Set up LangSmith, Langfuse, or custom
- Set logging options — Control log levels and retention
Key benefits of framework configuration:
- Production readiness — Set up proper observability for production
- Debugging capability — Enable tracing for troubleshooting
- Performance monitoring — Track latency and throughput
- Compliance — Meet audit requirements with proper logging
Next steps: Set up LangSmith API key for production tracing, or configure logging retention to meet compliance requirements.
Ready to Try Lattice?
Get lifetime access to Lattice for confident AI infrastructure decisions.
Get Lattice for $99