Stop Flying Blind: See Exactly What Context Your AI Is Using
When I need to debug why my RAG queries aren’t returning expected results, I want to see exactly what context is being sent to the model, so I can identify whether the right sources are being retrieved and optimize token allocation.
Introduction
Every time you send a message to an AI, you’re making an implicit bet. You’re betting that the right context—your scenario configuration, your stack details, the relevant chunks from your sources—will actually make it into the prompt. But until now, that bet was made blind.
For research engineers optimizing RAG pipelines, this opacity is more than frustrating—it’s operationally risky. When your P95 latency SLO is 500ms and you’re debugging why certain queries underperform, you need to know: Did the model see the right sources? How much of your 8,000-token budget is being consumed by message history versus semantic search results?
The black box of context assembly makes debugging slow, optimization guesswork, and quality assurance nearly impossible.
How Lattice Helps
Lattice provides complete transparency into what’s happening inside the context window through a unified context bar system. Positioned prominently in the Lab panel, the context visibility system gives you at-a-glance awareness of every component of your AI’s context—before you send a message.
No more wondering if your scenario SLOs are being respected. No more guessing which sources will be retrieved. The context bar shows you the full breakdown: active scenario, configured stack, sources in context, message history, and token budget—all in a single compact row.
Context Visibility in Action
Lattice offers two complementary ways to monitor and control your context: the Unified Context Bar for at-a-glance monitoring with integrated controls, and the Context Summary Bar for detailed breakdowns when you need to dig deeper.
Unified Context Bar: Everything in One Row
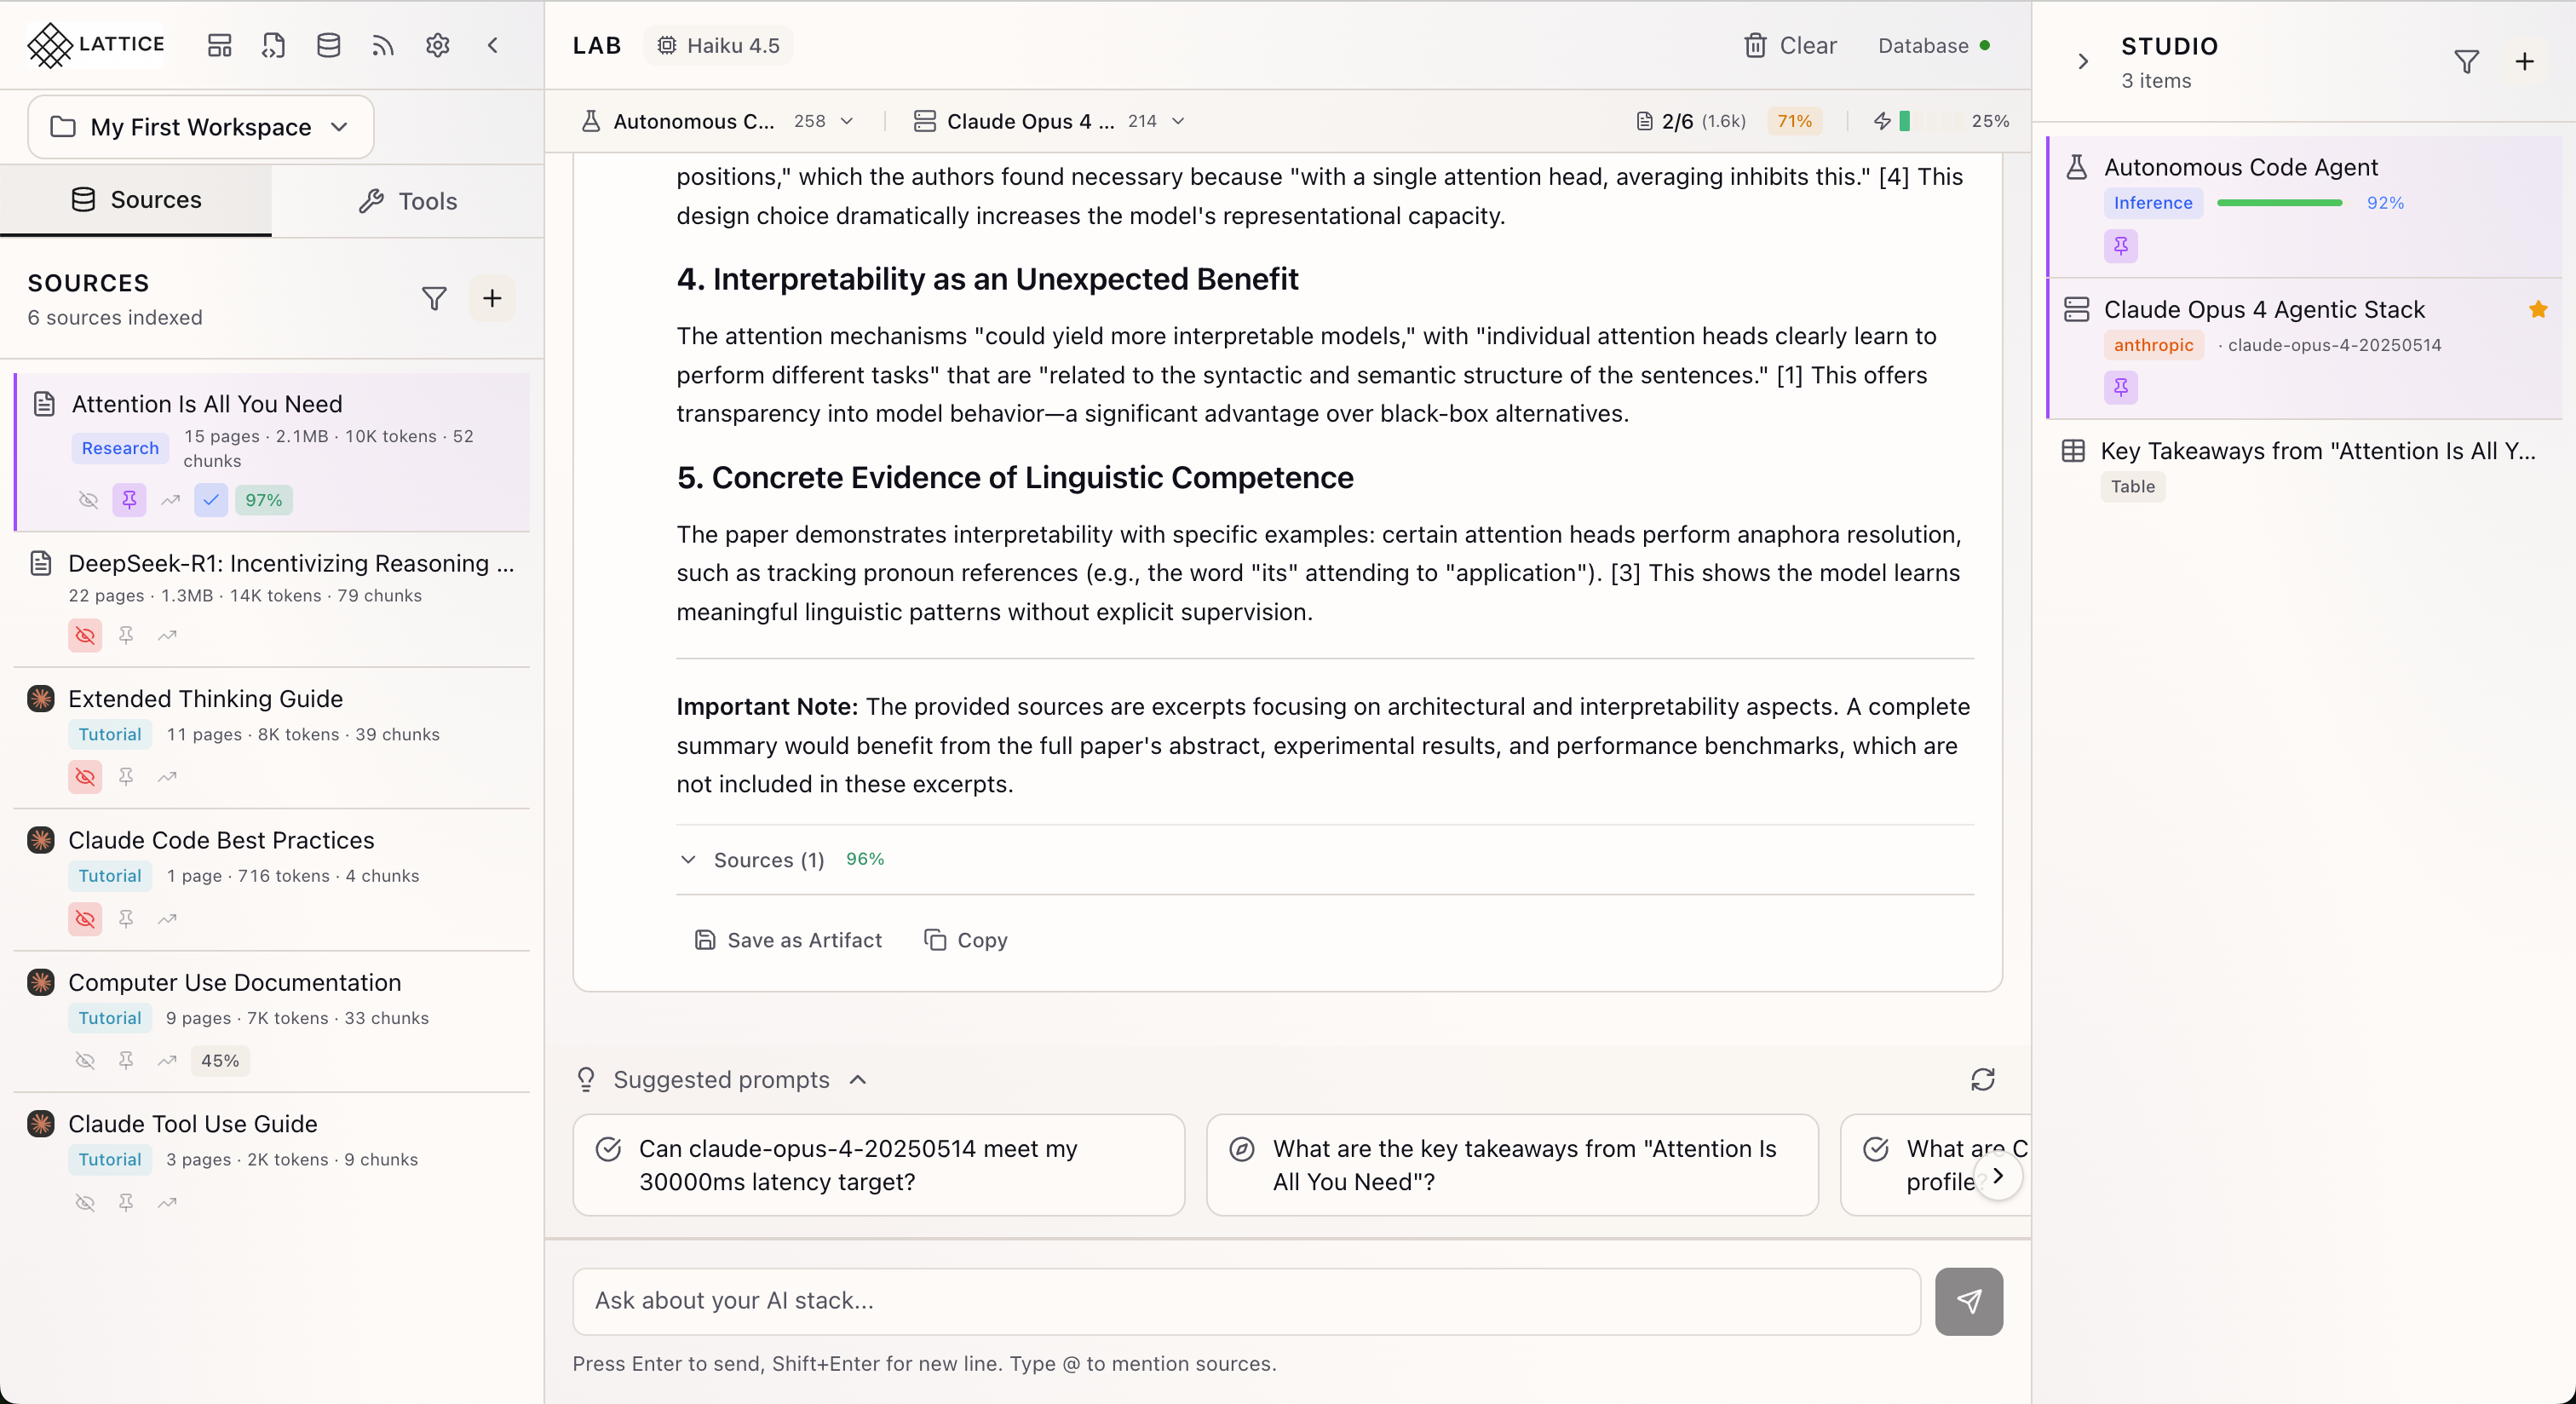
The Unified Context Bar consolidates scenario selection, stack selection, and context metrics into a single compact row:
[Scenario] | [Stack] ... [Sources] [Rel%] [Msgs] | [Battery]Integrated Scenario and Stack Selection:
- Click the Scenario dropdown to switch scenarios without leaving your workflow
- Click the Stack dropdown to change your infrastructure configuration
- Token counts appear inline next to each selection, showing their context footprint
Real-Time Context Metrics:
- Sources indicator: Shows sources in context vs. total (e.g., “3/10”) with token count
- Relevance badge: Color-coded average relevance score (green 80%+, amber 50%+, gray below)
- Messages count: Number of messages in context with token allocation
Token Battery Indicator
The signature feature is the mini battery-style indicator—five segments that fill based on your token usage:
- Green segments (under 60%): Comfortable headroom for additional context
- Amber segments (60-80%): Approaching the limit, prioritization in effect
- Red segments (over 80%): Near capacity, some content may be truncated
The battery provides instant visual feedback without requiring you to interpret numbers. A quick glance tells you whether you have room for a longer query or if you’re running tight on context.
Context Summary Bar: Detailed Breakdown
For deeper analysis, the Context Summary Bar offers an expandable view with comprehensive token breakdowns:
Collapsed View: Context pills showing each active component:
- Scenario pill: Active scenario name with token count (e.g., “Cost Analysis (850 tokens)”)
- Stack pill: Configured stack with token allocation (e.g., “Claude API (320 tokens)”)
- Sources pill: Sources in context vs. total, with average relevance percentage
- History pill: Message count and token consumption
Expanded View: Click to reveal the full breakdown:
- Token Budget Progress Bar: Visual representation of current usage against the maximum budget
- Component Breakdown Grid: Four cards showing precise token allocation for scenario, stack, sources, and history
Context Control Menu: Fine-Grained Source Control
Beyond visibility, you can actively control which sources participate in context:
Three-Mode Control:
- Include: Force a source into context regardless of semantic relevance
- Auto (default): Let semantic search decide based on relevance scores
- Exclude: Prevent a source from ever appearing in context
Advanced Options:
- Pin to All Queries: Always include a source, ensuring critical documentation is never omitted
- Boost Relevance (+50%): Apply a 1.5x multiplier to a source’s relevance scores
Real-World Scenarios
Debugging RAG Quality Issues
A research engineer notices that queries about training infrastructure aren’t returning expected recommendations. Opening the Unified Context Bar reveals the problem: only 2 of 8 sources are in context, and the relevance badge shows 42%—below the amber threshold. Clicking through to the source panel, they see that the “Training Best Practices” PDF is set to Auto mode but scoring low on relevance. Solution: pin that source to ensure it’s always included, and the next query immediately shows improved results.
Optimizing Token Budget
A platform team is hitting latency SLOs but wants to optimize costs by reducing token usage. The expanded Context Summary Bar shows that message history is consuming 3,200 tokens (40% of budget) while only 1,800 tokens are going to source retrieval. They adjust the conversation pruning settings to prioritize recent context and increase the source token allocation—immediately seeing the battery indicator shift from amber back to green.
Pre-Flight Check Before Critical Queries
Before running a critical cost comparison query, a technical lead checks the unified context bar to confirm: the “Cost Analysis” scenario is selected in the dropdown (not the default), the “Multi-Cloud” stack is active, and sources show “4/4” indicating all vendor pricing sources are in context. The green battery confirms headroom for a thorough response. They send the query with confidence.
What You’ve Accomplished
By using the context visibility system, you can now:
- See exactly what context is being sent to the model before each query
- Monitor token allocation across scenarios, stacks, sources, and message history
- Control which sources participate in context with include, exclude, and boost options
- Optimize token budget allocation based on real usage data
What’s Next
The context visibility system continues to evolve. Related features you might explore:
- Source Context Badges: Visual indicators on source cards showing cited, mentioned, pinned, and boosted states
- RAG Settings: Configure search mode, weights, chunk limits, and token budget in Settings
- Dynamic Category Taxonomy: Organize sources by type with automatic categorization
Context visibility features are available in Lattice v0.8.4+. The Unified Context Bar with battery indicator was introduced in v0.9.6.
Ready to Try Lattice?
Get lifetime access to Lattice for confident AI infrastructure decisions.
Get Lattice for $99