TCO Calculator
When I need to evaluate infrastructure options, I want to compare API and self-hosted costs with break-even analysis, so I can make data-driven decisions on when to migrate to self-hosted infrastructure.
The Challenge
Finance asks: “Should we keep using Claude API or deploy our own infrastructure?” The question seems straightforward, but the answer requires modeling a dozen interacting variables. API costs scale linearly with usage—$3 per million input tokens, $15 per million output tokens for Claude 3.5 Sonnet. Self-hosted costs are mostly fixed—$31.21 per hour for an A100 instance whether you’re running at 10% or 90% utilization.
The break-even point depends on your request volume, average token count, instance utilization, and hidden costs that rarely make it into back-of-envelope calculations. Network egress, storage, load balancers, monitoring, and ops time add 20-40% to raw GPU costs. A spot instance strategy might save 70% on compute but adds complexity and interruption risk.
Most teams either default to API (simpler, pay-per-use) or commit to self-hosting (feels cheaper at scale) without modeling the actual crossover. The wrong choice at 100K requests/month might cost $5K annually. The wrong choice at 10M requests/month could cost $500K.
How Lattice Helps
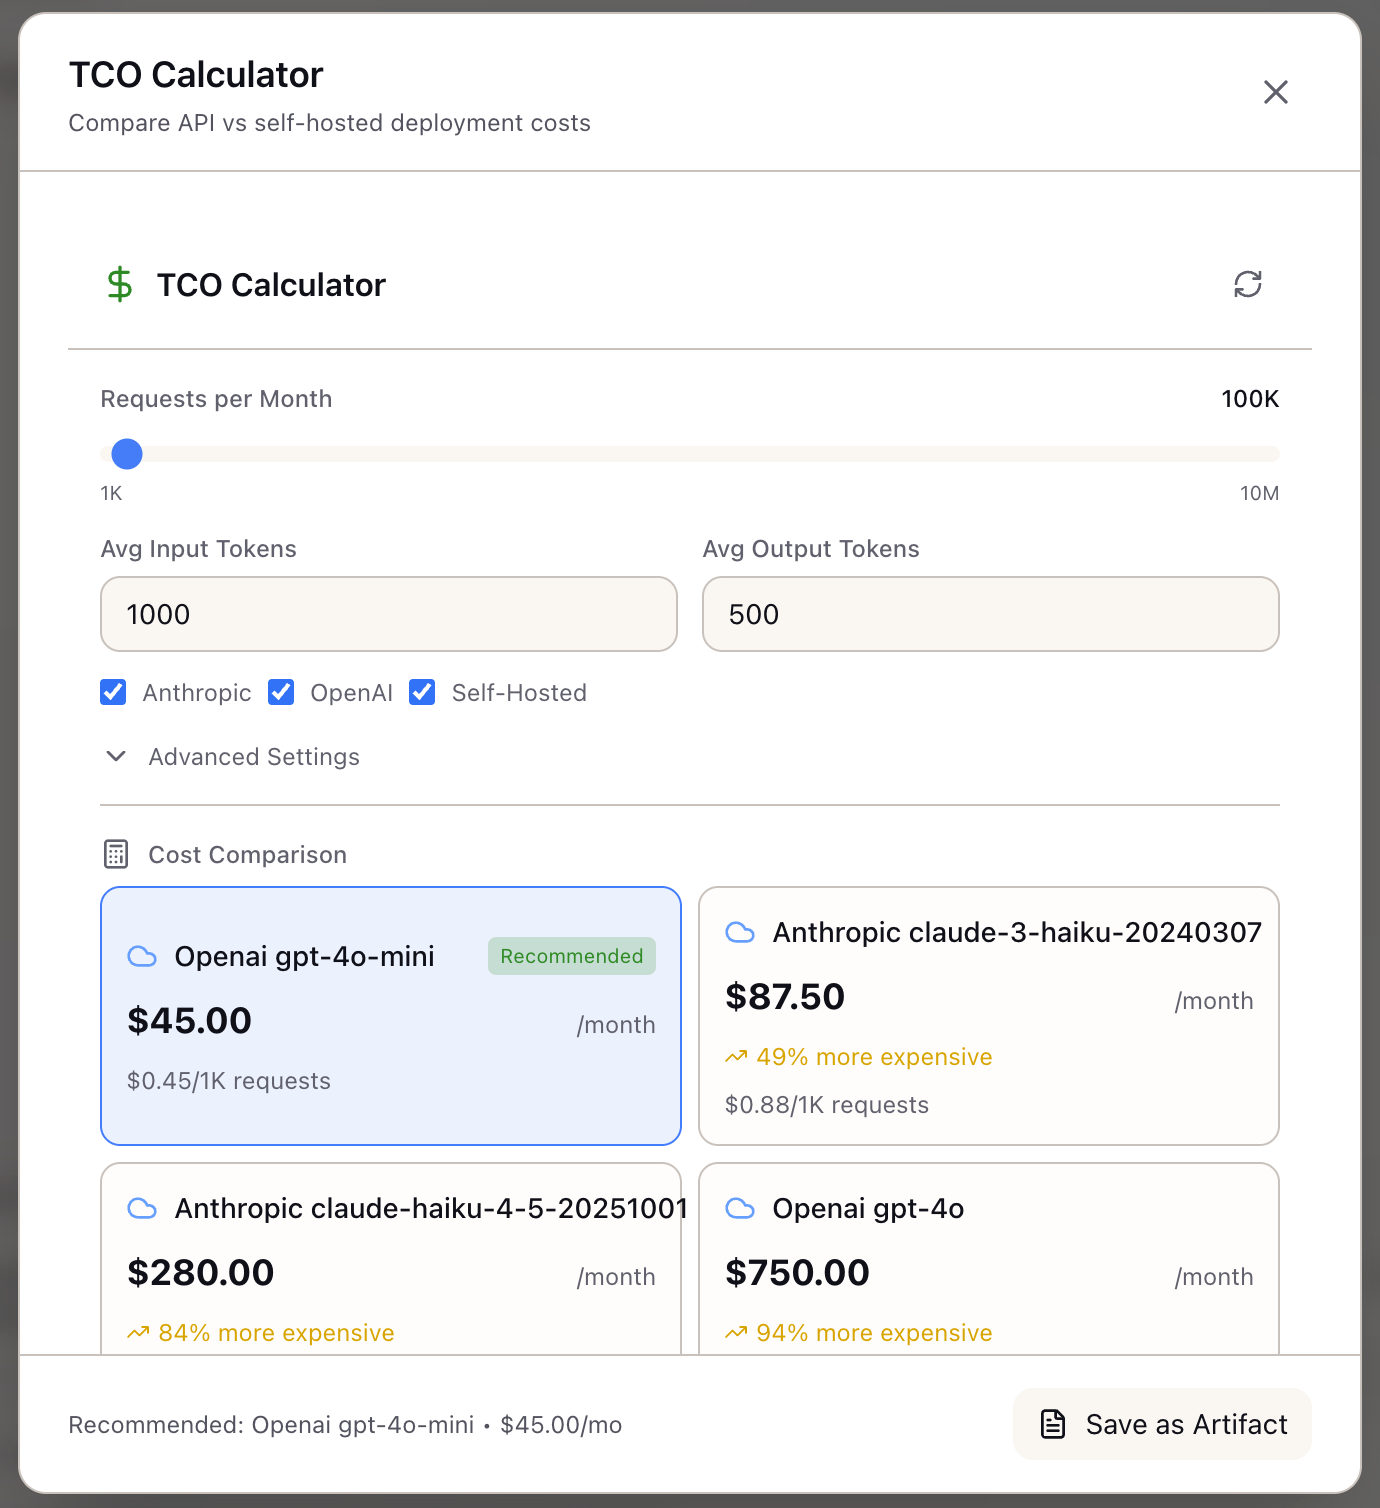
The TCO Calculator models the complete cost picture for both API and self-hosted options. Instead of comparing API pricing to GPU hourly rates, you compare fully-loaded monthly costs including infrastructure, operations, and hidden expenses.
The calculator doesn’t just compute totals—it finds break-even points. At what volume does self-hosting become cheaper? How many months until you recoup infrastructure investment? When do reserved instances beat on-demand? These answers require running the numbers across your actual scenario, not generic benchmarks.
Configuring Your Scenario
Usage Volume:
Set your expected request volume using the slider:
- Requests per Month: 1K to 10M requests
- The UI shows tick marks at common thresholds (10K, 100K, 1M)
Token Profile:
Enter your average tokens per request:
- Input Tokens: Average prompt length (typical: 500-2000)
- Output Tokens: Average response length (typical: 200-1000)
Example profiles:
| Use Case | Input Tokens | Output Tokens |
|---|---|---|
| Chat assistant | 500 | 300 |
| Document Q&A | 2000 | 500 |
| Code generation | 1000 | 800 |
| Summarization | 4000 | 400 |
Provider Selection:
Check which options to compare:
- Anthropic: Claude 3.5 Sonnet, Claude 3 Haiku
- OpenAI: GPT-4o, GPT-4o-mini
- Self-Hosted: AWS, GCP, Azure GPU instances
Understanding the Results
Cost Comparison Cards:
Each option shows:
- Monthly Cost: Total cost at your volume
- Annual Cost: Projected 12-month cost
- Cost per Request: Unit economics
Example output for 100K requests/month with 1000 input, 500 output tokens:
| Option | Monthly | Annual | Per Request |
|---|---|---|---|
| Claude 3.5 Sonnet | $4,500 | $54,000 | $0.045 |
| GPT-4o | $3,750 | $45,000 | $0.038 |
| Self-Hosted (A100) | $25,894 | $310,728 | $0.259 |
The recommended option shows a checkmark. At this volume, APIs win decisively.
Break-Even Analysis:
The calculator shows where self-hosting becomes competitive:
Break-even: 575,000 requests/monthSelf-hosting becomes cheaper above this volumeA visualization chart shows cost curves intersecting at the break-even point. Below the break-even, API costs are lower. Above it, self-hosted infrastructure pays off.
Advanced Settings
Expand Advanced Settings for detailed configuration:
Self-Hosted Infrastructure:
| Setting | Options | Default |
|---|---|---|
| GPU Type | A100 40GB, A100 80GB, H100 | A100 80GB |
| GPU Count | 1-8 | 2 |
| Cloud Provider | AWS, GCP, Azure | AWS |
| Instance Type | On-demand, Spot, Reserved (1yr/3yr) | On-demand |
Hidden Costs:
| Cost | Description | Default |
|---|---|---|
| Network Egress | GB transferred out | $0.09/GB |
| Storage | Model weights, logs | $0.08/GB |
| Load Balancer | Monthly fixed cost | $25 |
| Monitoring | DataDog, Grafana | $100 |
| Ops Hours | Engineer time | 10 hrs @ $100/hr |
These hidden costs add 20-40% to raw GPU pricing. The calculator includes them by default so break-even analysis reflects real costs.
Technical Deep Dive
Pricing Model
API Costs:
monthly_cost = (requests x input_tokens x input_price_per_M / 1M) + (requests x output_tokens x output_price_per_M / 1M)Current pricing (as of December 2025):
| Model | Input (per M) | Output (per M) |
|---|---|---|
| Claude 3.5 Sonnet | $3.00 | $15.00 |
| Claude 3 Haiku | $0.25 | $1.25 |
| GPT-4o | $2.50 | $10.00 |
| GPT-4o-mini | $0.15 | $0.60 |
Self-Hosted Costs:
compute_monthly = gpu_count x gpu_hourly x hours_per_month x (1 - discount)network_monthly = egress_gb x price_per_gbstorage_monthly = storage_gb x price_per_gbops_monthly = ops_hours x hourly_ratemonitoring_monthly = fixed_monitoring_cost
total_monthly = compute + network + storage + ops + monitoring + load_balancer
Instance pricing (AWS, on-demand):
| GPU | Instance | Hourly |
|---|---|---|
| A100 40GB | p4d.24xlarge (8 GPU) | $32.77 |
| A100 80GB | p4de.24xlarge (8 GPU) | $40.97 |
| H100 | p5.48xlarge (8 GPU) | $98.32 |
Spot discounts: 60-70% off on-demand Reserved (1yr): 30-40% off on-demand Reserved (3yr): 50-60% off on-demand
Break-Even Calculation
break_even_requests = self_hosted_monthly / api_cost_per_request
months_to_recoup = initial_investment / (api_monthly - self_hosted_monthly)
The calculator solves for the crossover point where API and self-hosted cost curves intersect.
Real-World Scenarios
A startup at 50K requests/month runs the TCO Calculator and finds API costs $2,250/month vs self-hosted at $26,000/month. Break-even is at 575K requests. They stick with Claude API and revisit when they hit 300K requests—well before break-even, but close enough to start planning infrastructure.
An enterprise at 5M requests/month discovers they’re spending $225K/month on API. Self-hosted with reserved H100 instances would cost $98K/month. They’ve crossed break-even by 4x. The calculator shows 4-month payback on infrastructure investment. They start planning migration.
A platform team evaluating GPU options compares A100 vs H100 at their expected 1M requests/month. A100 80GB costs $41K/month with throughput of 500 req/s. H100 costs $98K/month but achieves 1500 req/s. The TCO Calculator shows H100 has lower cost-per-request despite higher hourly rate—throughput matters more than GPU cost.
What You’ve Accomplished
You now have a systematic approach to infrastructure cost analysis:
- Model complete costs including hidden infrastructure expenses
- Find the exact break-even volume for your workload
- Compare multiple providers and instance types
- Make data-driven migration decisions
What’s Next
The TCO Calculator integrates with other Lattice cost intelligence tools:
- Spot Instance Advisor: Model spot vs on-demand trade-offs for self-hosted
- Memory Calculator: Verify model fits on selected GPU
- Model Registry: Pull current API pricing for selected models
- Stack Configuration: Apply TCO-optimized infrastructure to stacks
TCO Calculator is available in Lattice. Model your infrastructure costs before committing to deployment strategy.
Ready to Try Lattice?
Get lifetime access to Lattice for confident AI infrastructure decisions.
Get Lattice for $99