GPU Memory Planning Walkthrough
When I plan a training run, I want to model GPU memory requirements before launching, so I can avoid OOM crashes and optimize batch size for maximum throughput.
The Challenge
Your training job crashes at step 1,247 with a CUDA out-of-memory error. You’re running Llama 3.1 8B on a single A100 40GB - a configuration that should work according to the blog post you read last week. But that post didn’t account for your 8K sequence length, your batch size of 4, or the fact that AdamW optimizer states alone consume 2x your model parameters in FP32.
This scenario plays out constantly across AI teams. A research engineer spends hours configuring a training run, submits it to the cluster, waits for resources, and watches it fail within minutes. The Memory Calculator eliminates this guesswork by modeling memory requirements upfront.
The Starting Point: A Training Scenario
Let’s work through a realistic example. You’re a research engineer tasked with fine-tuning Llama 3.1 8B on your company’s internal documentation.
Your constraints:
- Model: Llama 3.1 8B (8.3 billion parameters)
- Hardware: 4x A100 40GB GPUs (single node with NVLink)
- Data: Long documents requiring 8K context
- Goal: Maximize throughput while fitting in memory
Step 1: Establish the Baseline
Open the Memory Calculator from the Tools section in the Studio panel. Start with the default configuration to understand your baseline memory requirements.
Select the model preset:
- Click the model dropdown and select
llama-3-8b - The calculator auto-populates the architecture parameters
Configure basic training parameters:
- Set Batch Size to 1 (we’ll optimize this later)
- Set Sequence Length to 8192 (your 8K context requirement)
- Keep Precision at BF16 (standard for modern training)
Review the baseline results:
The calculator shows your baseline memory breakdown:
- Parameters: Model weights + FP32 master weights for mixed precision
- Gradients: Same size as parameters in BF16
- Optimizer States: AdamW stores 2 FP32 states per parameter
- Activations: Attention scores and intermediate values
Step 2: Apply Parallelism
With 4 GPUs available, parallelism can distribute the memory load. Open the Advanced Settings panel.
Configure tensor parallelism:
- Set Tensor Parallelism (TP) to 4
- Leave Pipeline Parallelism at 1 (not needed for this model size)
- Leave Data Parallelism at 1 (we’ll use TP instead)
Review the impact:
The calculator immediately recalculates, dividing memory across GPUs:
- Parameters, gradients, optimizer states, and activations all reduce by 4x
- Peak memory drops to a manageable level per GPU
Step 3: Optimize Batch Size
With memory headroom, you can increase batch size to improve training throughput.
Increase batch size incrementally:
- Change Batch Size from 1 to 2, then 4
- Watch peak memory increase (activations scale linearly with batch)
- Stop when you reach 85% memory utilization
At batch size 4, you achieve 84% memory utilization - optimal for leaving headroom for activation spikes and CUDA workspace.
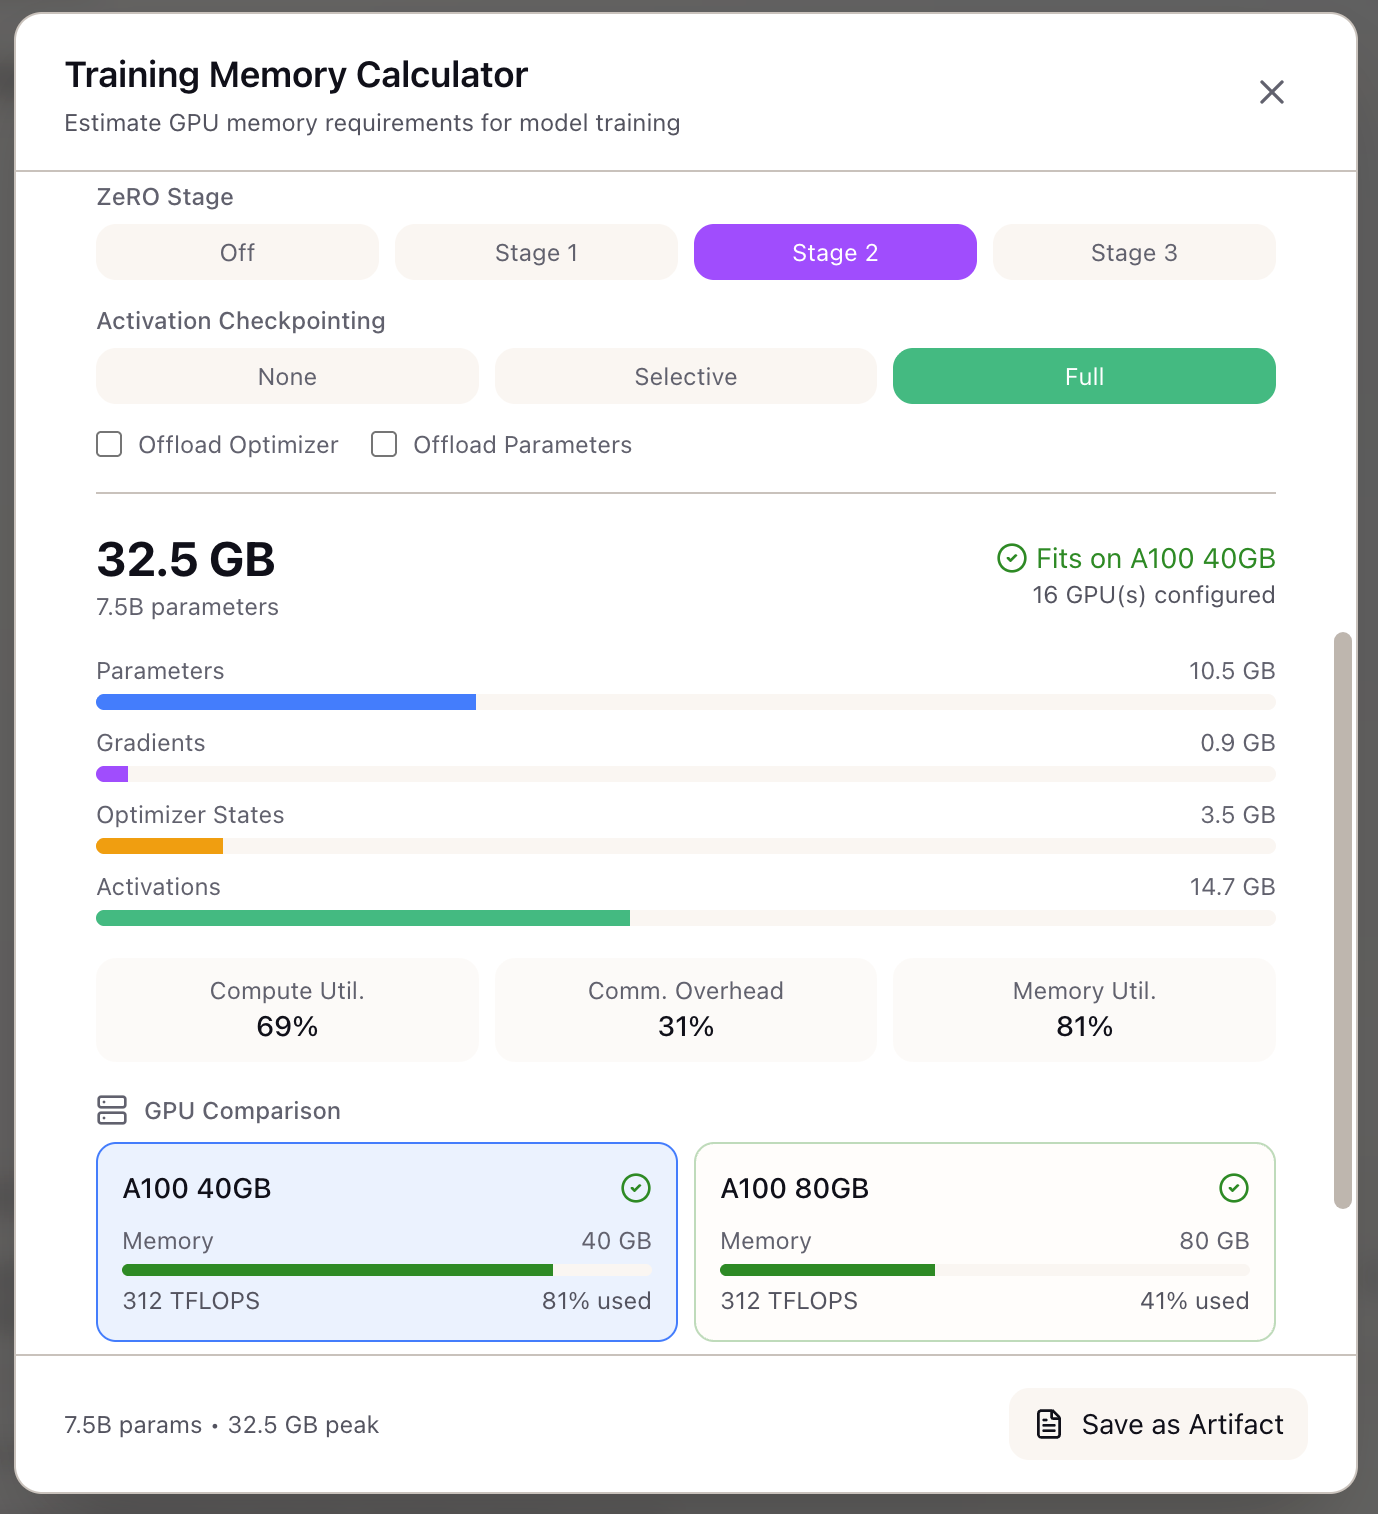
Step 4: Explore Alternatives with ZeRO
What if you wanted to use Data Parallelism instead of Tensor Parallelism? ZeRO can shard optimizer states across GPUs.
Switch to ZeRO-based configuration:
- Set Tensor Parallelism back to 1
- Set Data Parallelism to 4
- Set ZeRO Stage to 2 (shards optimizer states and gradients)
Enable activation checkpointing: If memory still exceeds limits, enable checkpointing:
- Set Activation Checkpointing to
selectiveorfull - Activations drop by 70-90%
- Trade-off: adds ~20-33% compute overhead from recomputation
Step 5: Make the Decision
Compare your viable configurations:
| Configuration | Peak Memory | Batch Size | Compute Overhead |
|---|---|---|---|
| TP=4 | 33.4 GB | 4 | 0% |
| ZeRO-2 + DP=4 + Checkpointing | 39.9 GB | 1 | ~20% |
The TP=4 configuration wins for this scenario because:
- Higher effective batch size (4 vs 1)
- No recomputation overhead
- Lower memory utilization (more headroom)
- NVLink handles TP communication efficiently within a node
Real-World Patterns
Pattern: Debugging OOM Errors
When a training run fails with OOM:
- Input your exact configuration into the Memory Calculator
- Check the memory utilization percentage - anything above 90% risks OOM
- The recommendations panel suggests optimizations ranked by impact
Pattern: Scaling to Larger Models
Moving from 8B to 70B requires different parallelism:
- Select the larger model preset
- With TP=4, you may still exceed GPU memory
- Add PP=2 (pipeline parallelism) to distribute layers
- Or use H100 80GB with TP=8 for simpler single-node training
Pattern: Maximizing GPU Utilization
If you’re paying for GPU time, maximize utilization:
- Start with target GPU (e.g., A100 80GB)
- Increase batch size until utilization reaches 85-90%
- The remaining 10-15% headroom prevents OOM from variable-length sequences
What You’ve Accomplished
You now have a systematic approach to GPU memory planning:
- Model memory requirements before committing GPU hours
- Compare parallelism strategies (TP vs ZeRO) with concrete numbers
- Optimize batch size for your specific hardware constraints
- Avoid trial-and-error OOM debugging
What’s Next
The Memory Calculator integrates with other Lattice tools:
- Parallelism Advisor: Get automated TP/PP/DP recommendations
- TCO Calculator: Factor memory-driven GPU choices into total cost analysis
- Framework Configs: Export DeepSpeed or FSDP configurations matching your settings
- Training Scenarios: Save your configuration as a scenario for future reference
The Memory Calculator is available in Lattice. Plan your GPU memory before your next training run.
Ready to Try Lattice?
Get lifetime access to Lattice for confident AI infrastructure decisions.
Get Lattice for $99