API vs Self-Hosted Cost Analysis
When I receive a request from Finance to evaluate infrastructure options, I want to build a comprehensive cost comparison with break-even analysis, so I can present a defensible recommendation for API vs self-hosted deployment.
The Challenge
The Slack message arrives from Finance: “We’re projecting $180K in API costs next quarter. Can you evaluate whether self-hosting would be cheaper?” You know the answer isn’t a simple spreadsheet calculation. You need to model current API spend, project self-hosted infrastructure costs, factor in hidden expenses, and identify the break-even point—all in a format that survives executive scrutiny.
The naive approach compares API pricing ($3/M input tokens) to GPU hourly rates ($32/hour for A100) and concludes self-hosting is obviously cheaper. But that misses utilization rates, ops overhead, network egress, reserved instance discounts, and the fact that you need 24/7 capacity to match API availability. A proper analysis requires modeling dozens of variables across both options.
This walkthrough shows how to use the TCO Calculator to build that analysis—from initial scenario setup through break-even visualization to artifact export for stakeholder presentations.
The Starting Point: Your Current State
You’re the platform lead for an AI product team. Here’s your situation:
- Current Usage: 500K API requests/month to Claude 3.5 Sonnet
- Token Profile: Average 1,200 input tokens, 600 output tokens per request
- Current Spend: ~$36K/month on API costs
- Projection: Usage expected to grow 3x over the next year
- Question: When (if ever) should we migrate to self-hosted infrastructure?
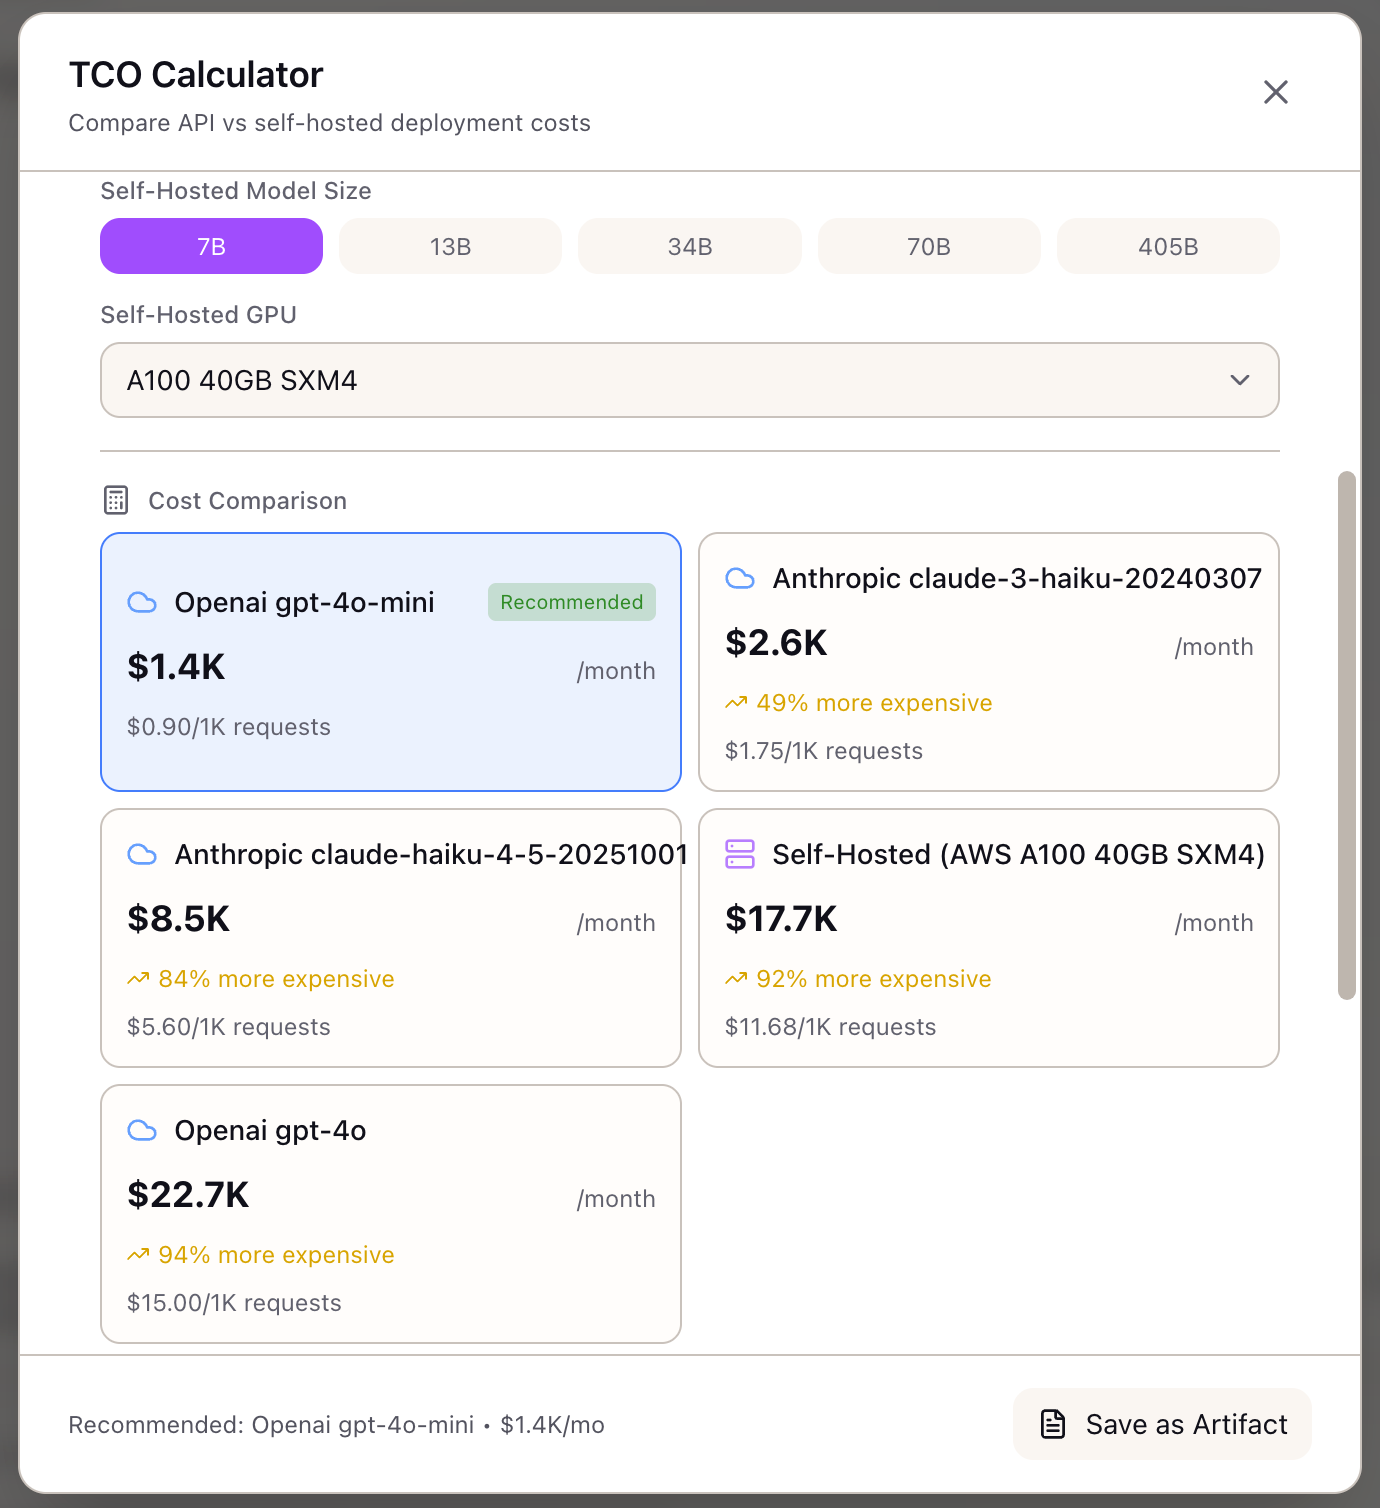
Step 1: Configure Your Usage Scenario
Open the TCO Calculator from the Tools section in the Studio panel.
Set your request volume:
- Drag the Requests per Month slider to 500K
- Or type 500000 directly in the input field
Configure your token profile:
- Set Average Input Tokens to 1200
- Set Average Output Tokens to 600
The calculator immediately shows estimated costs, but let’s refine the comparison.
Select providers to compare:
- Check Anthropic (your current provider)
- Check OpenAI (alternative API option)
- Check Self-Hosted (infrastructure option)
Step 2: Review Baseline API Costs
The calculator shows your current API costs:
Claude 3.5 Sonnet:
Monthly Input: 500K x 1,200 x $3.00/M = $1,800Monthly Output: 500K x 600 x $15.00/M = $4,500Total Monthly: $6,300Annual: $75,600Cost per Request: $0.0126Wait—that’s much lower than your actual $36K/month spend. The discrepancy reveals something important: either your token counts are higher than estimated, or you’re running more requests than you realized.
Adjust to match reality:
- Increase Average Input Tokens to 2,000
- Increase Average Output Tokens to 1,000
Now the calculation shows:
Monthly Input: 500K x 2,000 x $3.00/M = $3,000Monthly Output: 500K x 1,000 x $15.00/M = $7,500Total Monthly: $10,500Annual: $126,000Still not matching $36K. Let’s check request volume:
- Increase Requests per Month to 1.5M
Monthly Input: 1.5M x 2,000 x $3.00/M = $9,000Monthly Output: 1.5M x 1,000 x $15.00/M = $22,500Total Monthly: $31,500Annual: $378,000This is closer to your actual spend. The exercise reveals that your actual request volume is 3x what you thought—important context for the self-hosted analysis.
Step 3: Configure Self-Hosted Options
Expand Advanced Settings to configure infrastructure options.
GPU Selection:
- Select GPU Type: A100 80GB (standard for inference)
- Set GPU Count: 4 (estimated for your throughput)
- Select Cloud Provider: AWS
Instance Type:
Start with on-demand for baseline:
- Select Instance Type: On-demand
The calculator shows:
Self-Hosted (AWS A100 x 4):Compute: $31.21/hr x 730 hrs = $22,783Network Egress (500 GB): $45Storage (1 TB): $80Load Balancer: $25Monitoring: $100Ops (20 hrs x $100/hr): $2,000Total Monthly: $25,033Annual: $300,396Key insight: At 1.5M requests/month, self-hosted ($25K) is cheaper than API ($31.5K), saving $78K annually.
Step 4: Explore Cost Optimization Scenarios
Now let’s model different scenarios to understand the decision space.
Scenario A: Spot Instances
- Change Instance Type to Spot
- The calculator applies ~65% discount:
Compute: $22,783 x 0.35 = $7,974Total Monthly: $10,226Annual: $122,712Spot saves $180K annually vs on-demand, but adds interruption risk. The calculator shows a warning: “Spot instances may experience interruptions. Consider fallback strategy for production workloads.”
Scenario B: Reserved Instances (1 Year)
- Change Instance Type to Reserved (1yr)
- The calculator applies ~35% discount:
Compute: $22,783 x 0.65 = $14,809Total Monthly: $17,059Annual: $204,708Reserved instances save $95K vs on-demand with no interruption risk, but require upfront commitment.
Scenario C: Scale Projection (3x Growth)
What happens when usage hits 4.5M requests/month?
- Increase Requests per Month to 4.5M
- API costs scale linearly: $94,500/month ($1.13M annually)
- Self-hosted (with GPU scale-out to 12 GPUs): ~$75K/month
- Break-even gap widens: self-hosting saves $234K annually at this scale
Step 5: Analyze Break-Even
The calculator shows the break-even analysis:
Current Volume: 1.5M requests/monthBreak-Even Point: 850K requests/month
You are 1.76x above break-even.Self-hosting saves $78K annually at current volume.
The visualization shows:
- Blue line: API costs (linear, steep slope)
- Orange line: Self-hosted costs (mostly flat, slight slope from variable costs)
- Intersection: Break-even at 850K requests/month
Interpretation: You crossed break-even long ago. At current volume, self-hosting is clearly cheaper. The question isn’t whether to migrate—it’s when and how.
Step 6: Model Migration Scenarios
Now let’s understand the transition path.
Hybrid Approach: What if you self-host 80% of traffic and keep API for burst/overflow?
- Set Requests per Month to 1.2M (self-hosted portion)
- Self-hosted cost: ~$25K/month
- Remaining 300K via API: ~$6.3K/month
- Hybrid total: ~$31.3K/month
This is similar to pure self-hosted but provides API fallback. The 20% API buffer handles:
- Traffic spikes beyond GPU capacity
- GPU maintenance windows
- Regional failover
Staged Migration: Model a phased approach:
- Month 1-3: 100% API ($31.5K/month)
- Month 4-6: 50/50 hybrid ($28K/month)
- Month 7+: 80/20 hybrid ($31.3K/month) or full self-hosted ($25K/month)
Total Year 1 cost with staged migration: ~$330K vs staying on API: ~$378K Savings: $48K even with 6-month transition
Step 7: Export the Analysis
Once your analysis is complete, export it for stakeholders.
Save as Artifact:
- Click Save as Artifact in the modal header
- The artifact captures:
- Scenario configuration (volume, tokens, providers)
- Cost comparison table
- Break-even analysis
- Recommendation with reasoning
Apply to Scenario: Link the TCO findings to a training or inference scenario for integrated planning.
Apply to Stack: Use the infrastructure configuration (AWS, A100 x4, reserved) as the basis for a new stack definition.
Real-World Patterns
Pattern: Volume Uncertainty
When you’re not sure about future growth:
- Model 3 scenarios: current, 2x growth, 5x growth
- Identify the volume threshold where self-hosting becomes compelling
- Set up monitoring alerts at 80% of that threshold
Pattern: Multi-Model Comparison
When evaluating different models:
- Run TCO for Claude 3.5 Sonnet (current)
- Run TCO for Claude 3 Haiku (cheaper, possibly sufficient)
- Run TCO for GPT-4o-mini (alternative provider)
- Compare cost-per-request across quality tiers
Pattern: Make vs Buy Decision
When presenting to leadership:
- Lead with the break-even finding (e.g., “We crossed break-even at 850K”)
- Show current waste (e.g., “$78K annual overspend on API”)
- Present staged migration with risk mitigation
- Include ops requirements (team capability, monitoring investment)
What You’ve Accomplished
You now have a complete TCO analysis:
- Discovered actual request volume (3x initial estimate)
- Identified current position relative to break-even
- Modeled optimization scenarios (spot, reserved, hybrid)
- Documented migration path with risk mitigation
- Exported stakeholder-ready artifact
What’s Next
The TCO analysis feeds into other Lattice tools:
- Spot Instance Advisor: Detailed spot strategy if you chose spot pricing
- Stack Configuration: Apply TCO-derived infrastructure to your stack
- Evaluation Framework: Validate that self-hosted quality matches API baseline
- Memory Calculator: Verify GPU memory fits your model at batch size
TCO Calculator is available in Lattice. Model your infrastructure costs with confidence.
Ready to Try Lattice?
Get lifetime access to Lattice for confident AI infrastructure decisions.
Get Lattice for $99